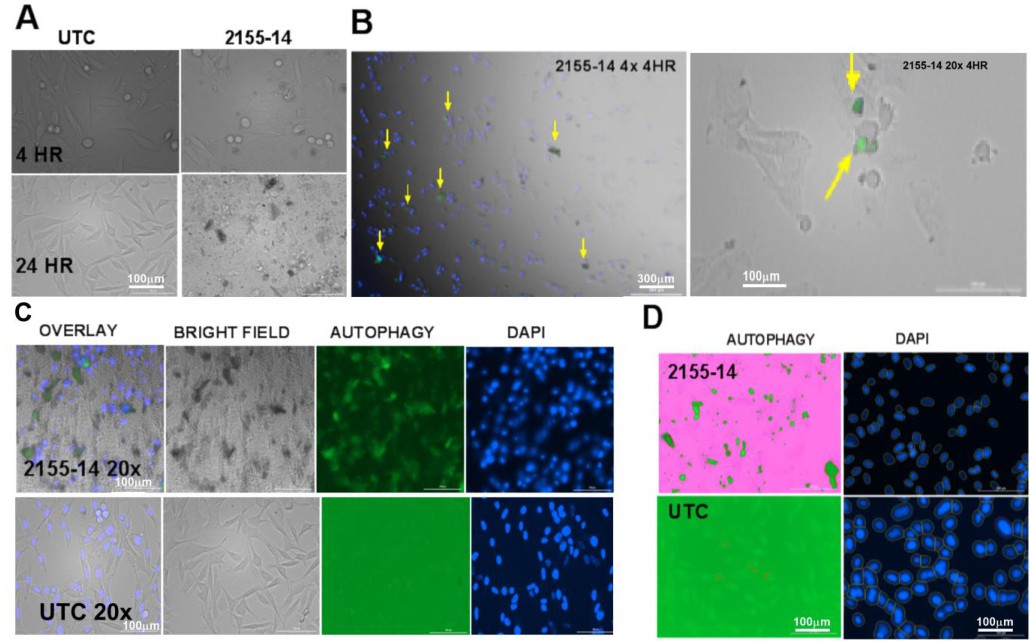
Fig. 2. Autophagy detection in WM266-4 cells using autophagosome dye. (A) Bright field micrographs at 4x magnification of unstained WM266-4 cells in the presence of 2155-14 and 2155-18 4 and 24 h after compound addition. Please note differences in cell morphology as compared to untreated control (UTC). (B) WM266-4 cells stain positive for autophagy at 4 h after addition of 2155-14, but not 2155-18. Nuclei are stained blue. Yellow arrows indicate green puncta signifying autophagosome formation. (C) WM266-4 cells show increased autophagy staining at 24 h after addition of 2155-14, but not 2155-18. Nuclei are stained blue. (D) Autophagy (GFP) channel was used to quantify positive WM266-4 cells. Number of cells present in each well was normalized using DAPI-stained nuclei. Scale bar = 100 µm for all images with 20x magnification and 300 µm for all images with 4x magnification.